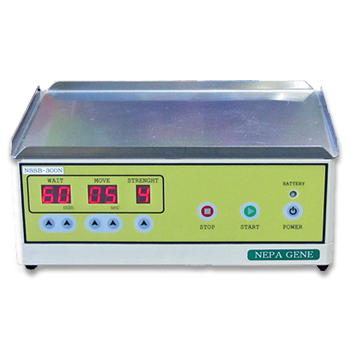
Liver/Skin/Embryos/Vessel/Other Applications
Liver/Skin/Other Applications
APPLICATIONS
Microbubble-Enhanced Sonoporation: Efficient Gene Transduction Technique for Chick Embryos
♦Procedures for sonoporation-mediated gene transduction. Procedures consist of two steps.

a, b: DNA-microbubble mixture was injected into chick limb bud at HH stages 20-21.
c, d: Immediately after injection, ultrasound irradiation was performed with the ultrasound probe placed adjacent to the injected site (introduction into the chick forelimb bud is illustrated in d).
♦Time course of GFP expression after sonoporation.

pEGFP was transduced into chick limb buds by utilizing sonoporation at HH stage 20-21.
Brightfield photos of the transduced limbs are shown in a-d. a, e: Three hours after transduction, GFP expression was detectable in the limb bud mesenchyme.
The level of GFP expression progressively increased (b, f), reaching a plateau after 12h of gene transduction (c, g).
d, h: The level of GFP expression decreased after 24h of transduction.
Scale bar = 1mm.
♦Histological analysis of transduced chick limb buds.

a: pEBActN-LacZ was introduced into limb buds (at HH stages 20-21) by utilizing sonoporation.
LacZ expression was detected in anterior limb buds after 12h. The white line in a represents the position of a section in b.
b: In the transverse section of a transduced limb bud, LacZ-positive cells were detected in the mesenchyme.
Scale bar = a: 1mm, b: 50um
♦Additional digit formation as a result of ectopic cShh expression.

c: Additional digits were observed upon transducing pCAGGScShh into anterior chick limb buds. a: pCAGGS-cShh and pEGFP were coexpressed to monitor gene transduction efficiency. GFP expression was detected in anterior limb buds. b: Normal wing formation 12h after sonoporation-mediated pEGFP transduction as a control. c: Digit 3 duplication with truncated digit 2 formation. The asterisk shows a small cartilaginous element as previously reported (Drossopoulou et al., 2000).
Scale bar = 1mm.
♦Serial gene transduction into the developing limb.

pEGFP was introduced first to the anterior limb mesenchyme. A second gene introduction into the posterior limb mesenchyme was performed immediately after the initial transduction. GFP expression was detected after 12h of the transduction at both sites.
Scale bar = 1mm.
Center for Animal Resources and Development (CARD) and Graduate School of Medical and Pharmaceutical Sciences, Kumamoto University: Sho Ohta, Gen Yamada
genesis, Volume 37, Issue 2, Pages 91-101, October 2003
Transfection into mouse external generative organs and chick limb buds.
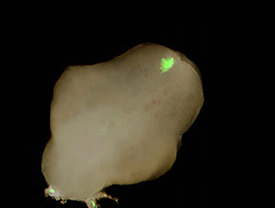
♦pCAGGS-GFP was transfected into mouse external generative organs (E13.5). The photo shows GFP expression 12 hours after electroporation.
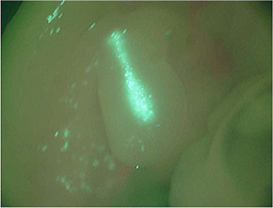
♦pCAGGS-GFP was transfected into chick limb buds. The photo shows GFP expression 24 hours after electroporation
Utility of Ultrasound Stimulation for Activation of Pig Oocytes Matured In Vitro
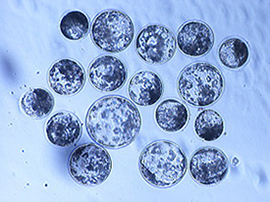
Pig blastocysts developed from oocytes activated by exposing to ultrasound at an intensity of 2.0 W/cm2 for 30 sec with 10% duty cycle in the sorbitol medium.
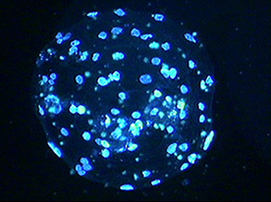
A pig blastocyst that was activated by exposure to ultrasound at an intensity of 2.0 W/cm2 for 30 sec with 10% duty cycle in the sorbitol medium and stained with Hoechst 33342.
♦Utility of Ultrasound Stimulation for Activation of Pig Oocytes Matured In Vitro
Laboratory of Animal Reproduction, Faculty of Agriculture, Kagoshima University: Kazuchika Miyoshi
Induction of Reparative Dentin Formation by Ultrasound-Mediated Gene Delivery of Growth/Differentiation Factor 11
♦Optimization of ultrasound-mediated gene transfer into pulp stem cells.
A: Intensity of ultrasound treatment at a frequency of 1MHz with 10% of Optison (Molecular Biosystems Inc., San Diego, CA).
Forty-eight hours after transfection of CMV-LacZ vector into the pulp tissue, the ratio of beta-galactosidase expression cells were counted in the cryosections and the efficiency was determined. The results are presented as the average of four experiments (means +/- standard deviation [SD]).
The optimal results were obtained at 0.5W/cm2 at 30 sec. Statistic analyses were done by Student’s paired t test.
B: Gene transfer into pulp tissue using pEGFP vector. Ultrasound was used at a frequency of 1 MHz with an intensity of 0.5W/cm2 at 30 sec.
The highest efficiency was obtained at 5% Optison. The efficiency was decreased at 20%, and was minimal at 50%.
C: Concentration of Optison. The results are presented as the average of four experiments (mean SD).
Five percent Optison was optimal and duration of ultrasound yielding optimal gene transfer was 30 60 sec.

The induction of the expression of dentin sialoprotein (Dsp) mRNA, a differentiation marker for odontoblasts in vitro organ culture.
The pulp tissue was amputated after extraction of the teeth, transfected with pEGFP-TIMP (A), CMV-LacZ vector (B, C) and pEGFP-TIMP-Gdf11 vector (D), and cultivated in the organ culture.
A: The confocal laser microscopic observation showing GFP particles in the pulp cells within 500m in depth from the amputated site.
B: The beta-galactosidase staining showing the homogenous transfection and no invasiveness and no necrosis of the pulp tissue under the amputated site (arrow).
C: Transgene LacZ expression (arrow) in the pulp cells in the sonicated region. Note the pulp cells are normal.
D: Whole-mount RNA in situ hybridization analysis showing the expression of Dsp mRNA (arrow) within 500um in depth from the amputated site, 7 days after sonoporation. The experiment was repeated four times and one representative experiment is presented.

The in vivo sonoporation of growth differentiation factored 11 (Gdf11) in the amputated pulp of dogs. Tissues were examined after 1 month. Forty micrograms of pEGFP-TIMP-Gdf11 vector (A C) and pEGFP-TIMP vector as a control (D) was applied by sonoporation at a frequency of 1 MHz, at intensity of 0.5 W/cm2, and with a pulse length of 30 sec.
A: Note the formation of the tubular dentin (TD) and osteodentin (OD) in the amputated pulp.
B: The higher magnification of the newly induced tubular dentin. The odontoblast-like cell with a long cell process (arrow).
C: Osteodentinoblast (arrow) producing matrix around them and embedded into osteodentin (OD).
D: No formation of the tubular dentin (TD) and osteodentin (OD) in the control.
Laboratory of Oral Disease Research, National Institute for Longevity Sciences, National Centre for Geriatrics and Gerontology
Misako Nakashima
Drug and Gene Delivery by "Bubble Liposomes" and Ultrasound

PEG-Liposomes

Bubble Liposomes
Fig.1. Aspect of PEG-Liposomes and Bubble Liposomes
PEG-liposomes sonicated with perfluoropropane gas became to bubble liposomes in the vial.

Optison

Bubble Liposomes
Fig. 2. Microscopy of Bubble Liposomes
Optison (GE Healthcare) and bubble liposomes were observed with a microscope using a Darklite illuminator (Micro Video Instruments).
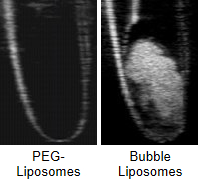
Fig. 3. Ultrasonographic Images of PEG-Liposomes and Bubble Liposomes
To confirm the perfluoropropane gas within bubble liposome, they were imaged with an ultrasound imaging machine. Liposomes were injected into latex tube in water bath and imaged. Bubble Liposomes made ultrasound echo signal increased, but PEG-liposomes did not so. Therefore, it confirmed that bubble liposomes were including perfluoropropane gas. In addition, it is expected that bubble liposomes are able to be utilized as ultrasound imaging agents.
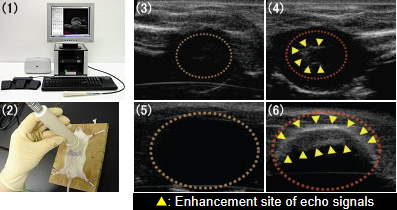
Fig. 4. Ultrasonographic Images of Heart and Urinary Bladder with Bubble Liposomes
(1) Ultrasound imaging machine for small animals: NP60R-UBM (NEPA GENE)
(2) Contrast method of the heart lumen
(3) Ultrasonographic Images of Heart (before injection of bubble liposome)
(4) Ultrasonographic Images of Heart (aefore injection of bubble liposome)
(5) Ultrasonographic Images of Urinary Bladder (before injection of bubble liposome)
(6) Ultrasonographic Images of Urinary Bladder (aefore injection of bubble liposome)
Bubble liposomes 100mg/100ml were injected into mouse tail vein. In the same time, probe of an ultrasound imaging machine was positioned on the heart of mouse.
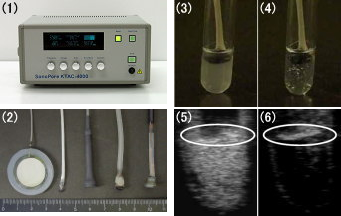
Fig. 5. Cavitation of Bubble Liposomes Exposed to Ultrasound.
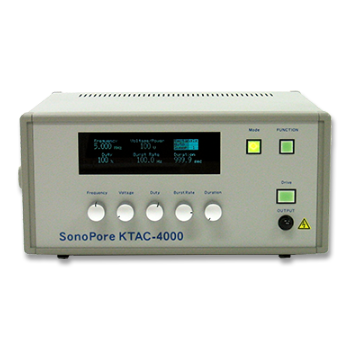
(1) Sonoporation gene transfection System: SonoPore4000 (NEPA GENE)
(2) Ultrasonic Probe
(3) Naked image (before US)
(4) Naked image (after US)
(5) Ultrasound image (before US)*
(6) Ultrasound image (after US)*
US: Ultrasound exposure
* White circle: Ultrasonic Probe
Ultrasound (2MHz, 2.5W/cm2, 10sec) disrupted bubble liposomes by inducing cavitations and then echo signals of these liposomes decreased. Cavitations of the Bubble liposomes were also visually obvious since suspensions were clarified after exposure to ultrasound.
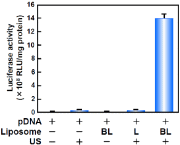
Fig. 6. Luciferase Expression in COS-7 Cells Transfected with Bubble Liposomes and Ultrasound Exposure
COS-7 cells (1×10⁵ cells/500![]() l) mixed with pCMV-Luc (5
l) mixed with pCMV-Luc (5![]() g) and Bubble liposomes (60
g) and Bubble liposomes (60![]() g) were exposed to ultrasound (Frequency: 2MHz, Duty cycle: 50%, Burst rate: 2Hz, Intensity: 2.5W/cm2, Time: 10sec). The cells were washed and cultured for 2 days and then luciferase activity was determined as described in Materials and methods.
g) were exposed to ultrasound (Frequency: 2MHz, Duty cycle: 50%, Burst rate: 2Hz, Intensity: 2.5W/cm2, Time: 10sec). The cells were washed and cultured for 2 days and then luciferase activity was determined as described in Materials and methods.
BL: Bubble liposomes, L: PEG-liposomes, US: Ultrasound
Combination of bubble liposomes and ultrasound exposure, luciferase expression was higher than other groups.
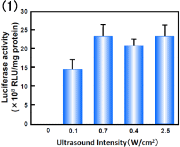
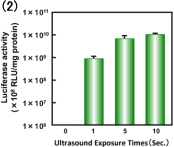
Fig. 7. Effect of ultrasound conditions on transfection efficiency with Bubble liposomes.
(1) Intensity: 0-2.5 W/cm2, Time: 10 sec
(2) Intensity: 2.5 W/cm2, Time: 0-10 sec
Common Conditions (Frequency: 2MHz, Duty cycle: 50%, Burst rate: 2Hz)
COS-7 cells (1×10⁵ cells/500l) were mixed with pCMV-Luc (5g) and Bubble liposomes (60g).
The cell mixture was exposed to ultrasound.
The cells were washed and cultured for 2 days, then luciferase activity was determined as described in Materials and methods. Each bar represents the meanS.D. for triplicat
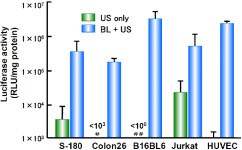
Fig. 8. Luciferase Expression in Various Types of Cells Transfected using Bubble Liposomes and Ultrasound
Cells (1×10⁵ cells/500l) mixed with pCMV-Luc (5g) and bubble liposomes (60g) were exposed or not to ultrasound (Frequency: 2MHz, Duty cycle: 50%, Burst Rate: 2Hz, Intensity: 2.5W/cm2, Time: 10sec). The cells were washed and cultured for 2 days. Thereafter, luciferase activity was determined as described in materials and methods. Data are shown as meansS.D. (n=3).
#<103 RLU/mg protein, ##<100 RLU/mg protein
Bubble liposomes with ultrasound more effectively transduced luciferase gene into all of these types of cells than ultrasound alone.
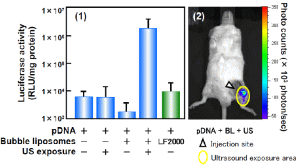
Fig. 9. Gene Delivery to Femoral Artery with Bubble Liposomes
Each sample containing plasmid DNA 10g was injected into femoral artery. In the same time, ultrasound (Frequency: 1MHz, Duty cycle: 50%, Burst rate: 2Hz, Intensity: 1W/cm2, Time: 2 min) was exposed to the downstream area of injection site.
1 Luciferase expression in femoral artery of the ultrasound exposure area at 2 days after transfection, Luciferase expression was determined as described in Materials and methods. Data are shown as meansS.D. (n=5).
LF2000: Lipofectamine 2000
2 In vivo luciferase imaging at 2 days after transfection in the mouse treated with plasmid DNA, bubble liposomes and ultrasound exposure. The photon counts are indicated by the pseudo-color scales.
To evaluate the ability of bubble liposomes to in vivo gene delivery, we attempted to deliver plasmid DNA with bubble liposomes into femoral artery. In this study, we also examined the gene delivery with conventional lipofection method (1). The gene expression with ultrasound or bubble liposomes was low level. In addition, the gene expression was very low even in using Lipofectamine 2000. However, in the combination of bubble liposomes and ultrasound exposure, gene expression was higher than other groups. And the gene expression was observed at only area of ultrasound exposure (2).
Department of Biopharmaceutics, School of Pharmaceutical Sciences, Teikyo University Ryo Suzuki, Naoki Utoguchi, Kazuo Maruyama
*Mebio Oncology, Volume 4, Number 2, Pages 36-47, 10 June 2007
PUBLICATIONS
Electroporation
■ Cell Cultures
- Primary Cell Cultures
- Stem Cells
- Organoids
- Cell Lines
- Cells in Adherence
■ In Vivo Mice/Rats
- Zygotes In Vitro (TAKE method)
- Zygotes In Oviduct (i-GONAD method)
- Embryos In Utero
- Ex Utero Embryos In Vitro
- Brain
- Retina / Cornea / Spinal Cord / Sciatic Nerve
- Lung / Spleen / Liver / Stomach/ Kidney / Intestine
- Pancreas / Islets of langerhans
- Testis / Ovary / Prostate / Gonad / Uterus
- Muscle / Skin / Joint / Cartilage / Tumor / Others
■ In Vivo Other Animals
- Bovine/Porcine/Other Animal Zygotes
- Hamster Zygotes in Oviduct (i-GONAD method)
- Monkey Skin
- Chicken (In Ovo・Others)
- Zebrafish & Other Fishes
- Insects・Others
■ Plant Cells & Algae
- Plant Cells
- Algae
■ Exosomes
- Exosomes
■ Bacteria, Yeast, Fungi
- E. coli/Bacterial Cells
- Yeasts/Fungi
- Bacterial cells/Yeasts/Fungi (NEPA Porator)
Drug Delivery and Transfection
■ Ultrasound Transfection and Drug Delivery (Sonoporation/Fus)
- Brain
- Liver/Skin/Other Applications
- Heart
- Cell Culture
- Lung
- Muscle
Electro Cell Fusion
■ Hybridoma Production
- Monoclonal antibodies, etc
■ Oocyte Activation
- Electrical stimulation before/after Intracytoplasmic sperm injection (ICSI)
■ Somatic cell nuclear transfer (SCNT)・ Oocytes Nuclear Transfer
- Animal cloning
■ Tetraploid Embryos Production
- 2 Cell Embryos (Tetraploid)
■ Other Applications
- Liposome・Protoplast・Yeast, etc.
Fluorescence Quenching / in situ Hybridization Chain Reaction
■ Autofluorescence Quenching
- Mammalian Tissue Sections
- Fish Tissue Sections
- Amphibia Tissue Sections
- Avian Tissue Sections
- Plant Tissue Sections
- Chordate Tissue Sections
■ in situ HCR
- Detection of Target mRNA
Single-Cell/Micro-Particle Transfer
■ Micro targets
- Animal cells
■ Micro liquid
- Plant cells
Cell Freezing
■ Cell Therapy
- Stem cells, primary cells, and more
■ Animal Husbandry
- Sperm, embryos, tissues, and more

